Project information
- Category: Data Analysis Application
- Purpose/Client: SolarSpec UBC
- Project date: June 22, 2022
Photodegradation Analysis Application
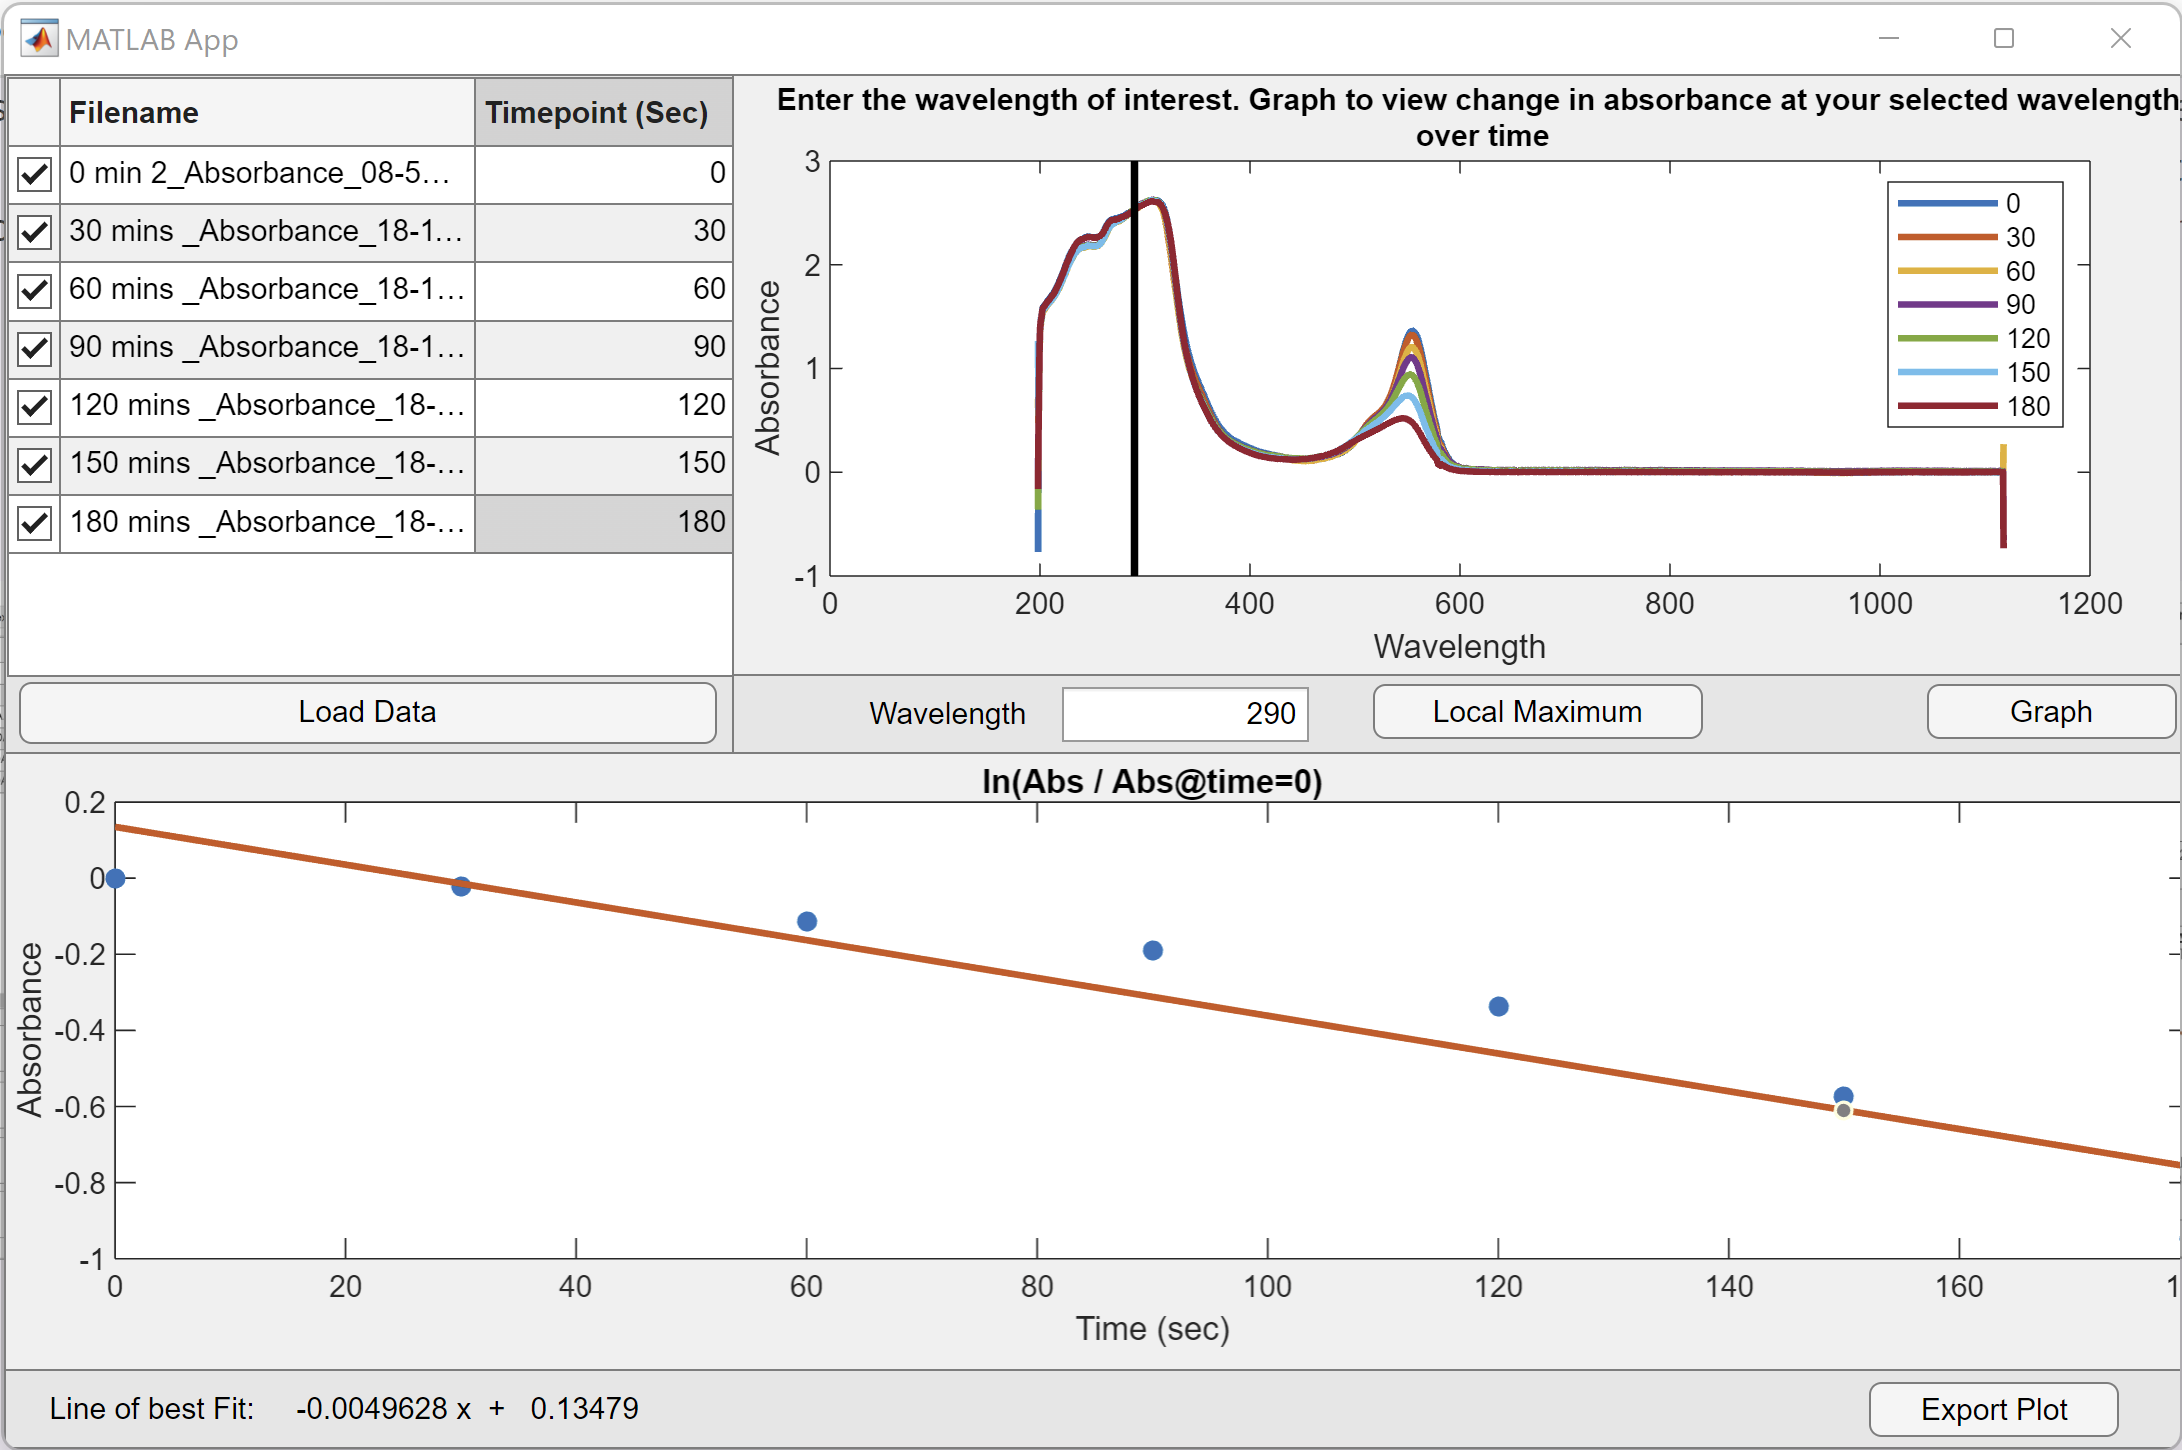
The photodegredation application compares data from different timepoints. The user selects a wavelength and data is linearized in the bottom graph. Aditional features include the temporary removal of timepoints, local maximum detection, and data exportation.
Process
This was the first GUI Application I developed as part of the SolarSpec team. I began by developing the main functions of the of the application by implementing data importation, user time input, main graph, and linearization. I then began working on the details such as the ability to remove current working data temporarily with checkmarks in the table. The plot visibility was simpler to implement, but the removal from the data in the linearization involved finding an index vector for the selected files. The final aspect implemented was the local maximum. There were multiple methods that were used, but I decided to have the user select the peak bounds and used a gaussian fit to find the peak. With all aspects implemented, I conducted bug testing and added catches for improper user error.
Challenges
Since I had not worked in an application writing context before, the learning curve was the biggest hurdle for me. I learn best in a learn as I do element, so this simple GUI was a great start to learning how to implement basic user interface elements. One aspect I struggled with was the temporary removal of a data set from the working data. This was difficult because the data set had to be adjusted without removing any data. I solved the situation by indexing the main data matrix from the information gathered from the table.
Another challenge I dealt with was a reliable function to detect a selected local maximum. The easiest way for the user to select a peak is to select the x bounds of the peak on the plot. This ensured a peak had to be detected from within the selected x range, but finding an accurate peak still was a challenge. MATLAB has a built-in peak detection function that I initially tried, but instead I decided to find the peak based on a gaussian fit function. This ensured the most prominent peak from the average of all the datasets is selected.
Learning Outcomes
The following are the skills I developed most:
- GUI Development: I learned the basics of what goes into creating user interface applications.
- Data Manipulation: Developed my understanding of how to work with and change data sets to accomodate different functions of code.