Project information
- Category: Data Analysis Application
- Purpose/Client: SolarSpec UBC
- Project date: September 06, 2022
HPLC Analysis Application
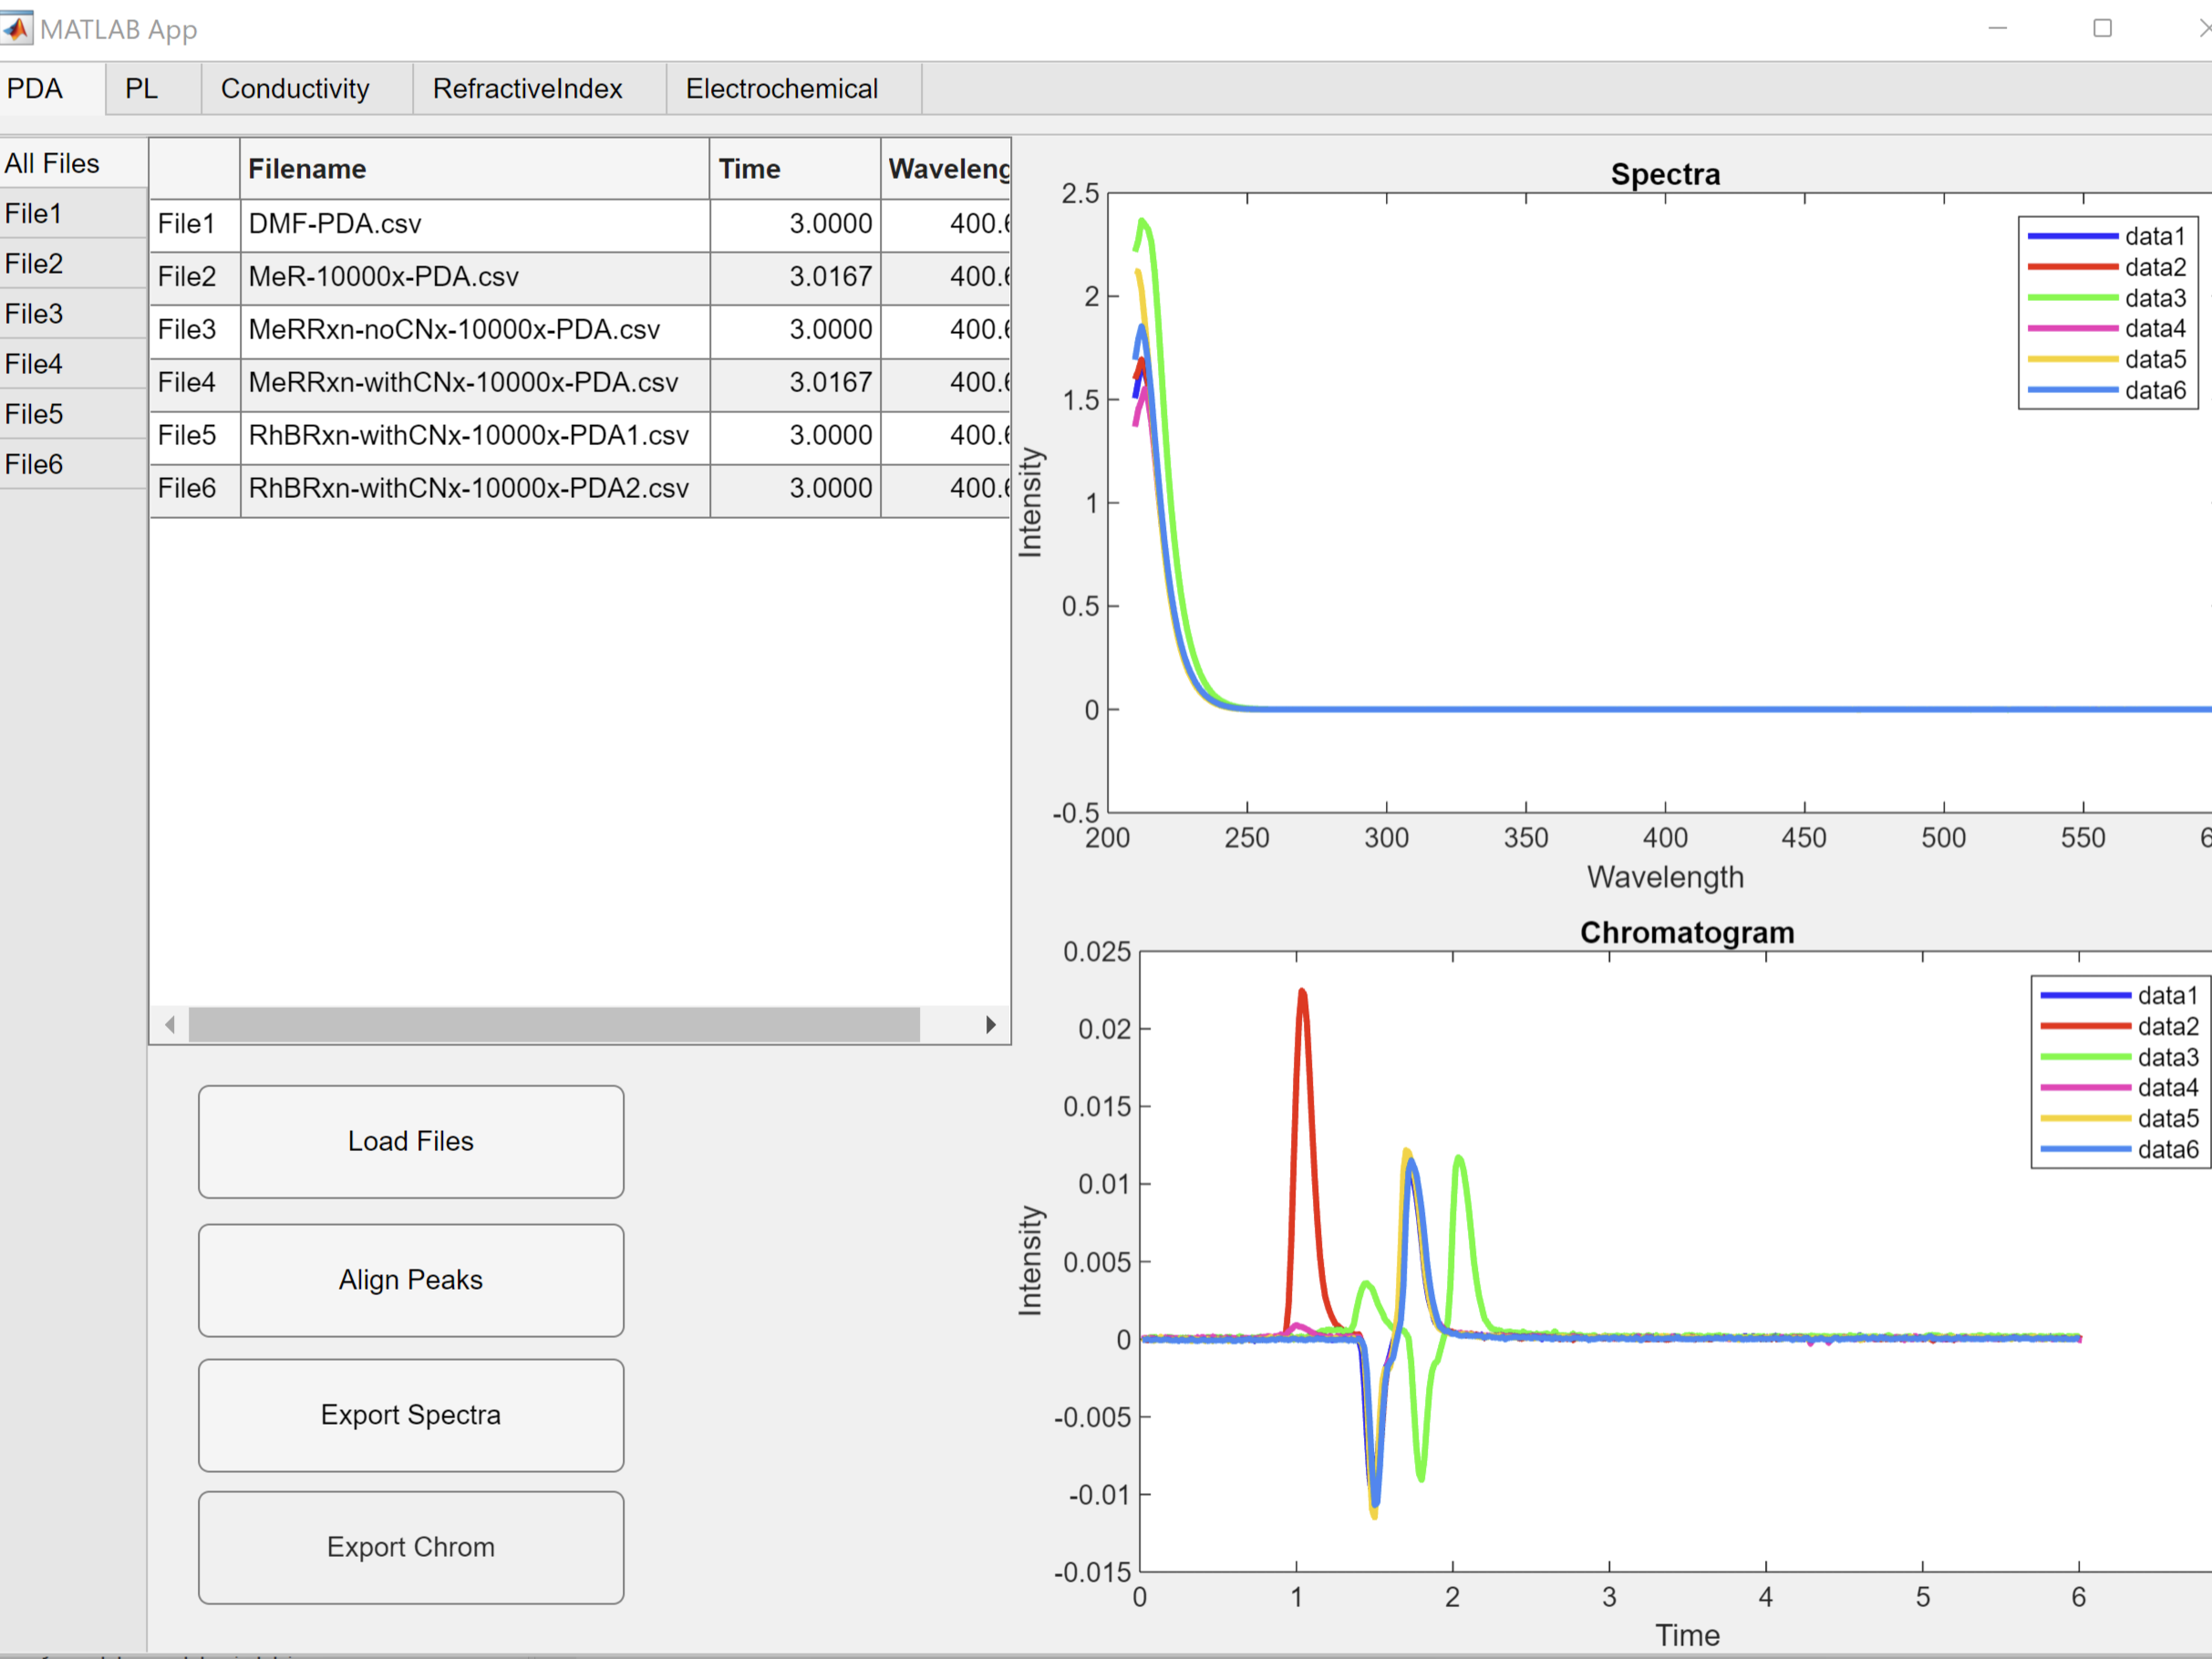
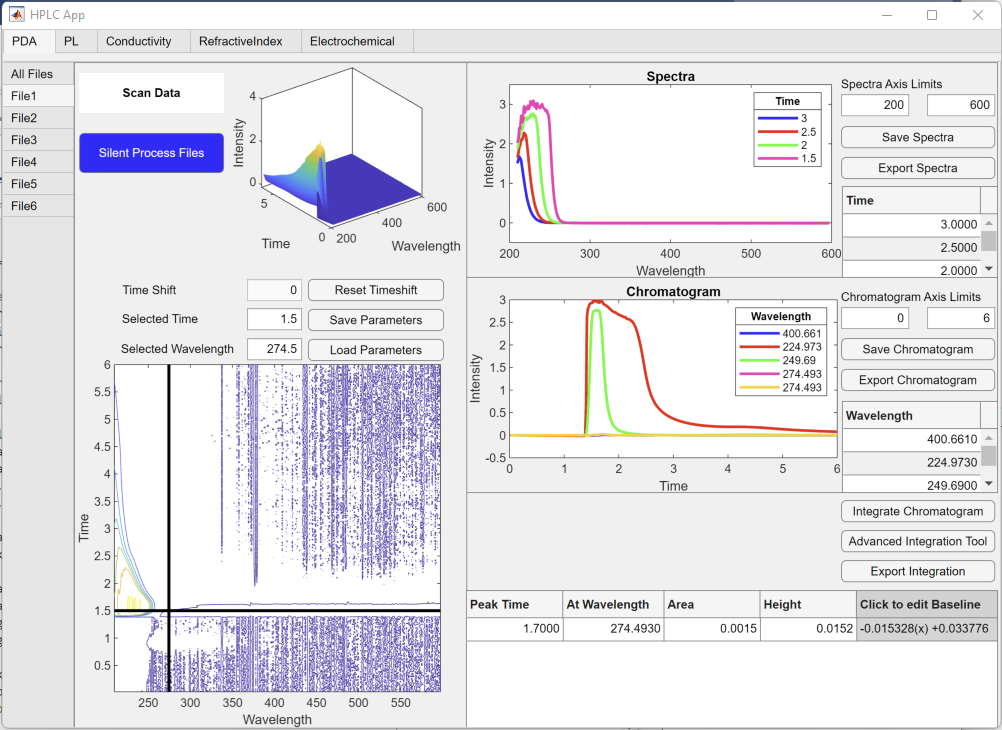
An application used to analyze High-performance liquid chromatography which deals with 3-dimensional data. This app allows for the comparison of multiple files from multiple detectors, extraction of spectra and chromatograms, as well as other analytic tools such as the spectra integrators.
Process
Since this project dealt with more complex structures and more functionalities than I had previously dealt with, it was vital that I divided the work into smaller portions and steps. I began by evaluating the major needs of the project to create a suitable layout that would be most user friendly. I do most of this planning with pen and paper to allow me to visualize the layout. I landed on a design of dividing the detectors by tab groups and further dividing each tab by files. I then created the data structures necessary to hold imported files. With this set up complete, I implemented the basic functions such as plots and text boxes. Each advanced functionality was added sequentially based on what made sense.
Challenges
One of the most difficult parts of this project was creating data structures and user elements that changed in size depending on file quantity, type, and data size. For this application, the number of file tabs depended on how many files are worked with by the user. Some files would require tabs that allowed 3-dimentional data analysis while others needed a different tab layout for single chromatogram data. This was a small roadblock in the start of the app development, but once I refined the ability to read the uploaded files better, I was able to organize the uploaded data and tab elements into MATLAB structure arrays. Each set of data, plot axis, and other elements were denoted by app.[element_name].[detector].[file_number]. The app set up was done in a for-loop, so every tab was set up sequentially.
Another challenging aspect was the automatic integration of spectra data. My first attempt at integrating the plot data involved user selection of the peak range. While this worked adequately in certain circumstances it was still very buggy and was not optimal for data with many peaks. I began looking further into code for automatic peak bounds detection and it was a common problem. I ended up creating a second internal application for advanced integration which would load the current data and allow for multiple options of integration methods. The bounds of the peaks were determined from detected valleys and end points. Peak and valley prominence sliders allow users to eliminate smaller valleys and peaks that may be noise or irregularities in data. There are also integration options for integrating based on a valley-to-valley line or based on the zero-base line. This data can be saved back to the main app. With this tool I created I was able to deal with a problem that often resulted in many errors by allowing users to adjust the settings manually while allowing the simplicity of automatic detection.
One other aspect that was difficult to implement was the time shift of data. In HPLC, the same test will run though different detectors at different times, so it is useful to have the ability to line up these connected data sets to peak at the same time. The first aspect of this challenge was creating the user ability to select two files from different detectors and display graphs for users to be able to select the peak on both files. Due to the layout of the application, it was useful to have a popup window where the user could select these two files. This involved having to create an internal secondary application. The second portion of this challenge was implementing the time shift to the file tab and file functions without obstructing the data set. To allow for this change, I had to adjust each related function to add the time adjustment to every calculation.
Learning Outcomes
The following are the skills I developed most:
- Data Structures: Developed my ability to work with data structures of varying size based on user interaction.
- User Interface Elements: Increased my experience with user interface elements past basic buttons and editable fields to plot manipulation and data export.
- Data Manipulation: Bettered my understanding of how to change data based on user input without affecting the original dataset.